“Storytelling with data is a vital skill an analyst must develop in order to allow the user to generate insights and trends from the dashboard. Tableau is like a book with empty pages waiting for you to write the story. It allows for simple and elegant designs while also allowing for creative and unique visualizations. Tableau is easy, intuitive, and will make you the data wiz on the team.”
TJ SizemoreDIRECTOR OF DATA AND ANALYTICS AT OPTILY 
 What we love:
- High graphic quality
- Easy-to-use (you don’t need to know code to get started)
- Amazing overall performance and speed
- Simple to sync to data sources
- Ready-made templates
- On-demand webinars and an amazing support community
- There’s a free version for you to practice on (but everything will be public)
 What could be better:
- It’s a bit pricey and the pricing plans are fairly rigid ($70/per user per month)
- While there is a free version, you probably won’t want your company data public
- There’s a lack of advanced IT support from Tableau
- Many dashboards can be built out without advanced coding, but not all. When some SQL queries do need to be set up, there is little support from the Tableau IT team in this regard
- It’s not a complete Business Intelligence tool
- You do need to invest time to truly master all the functionality and get the most out of Tableau
2. Whatagraph
Whatagraph is a new player on the scene, but this startup is already making a big splash. Purpose-built for marketing data, this visualization tool is incredibly powerful for cross-channel metrics. Social media marketers swear by this software. They especially love the elegant interface that enables them to easily build out cross-channel dashboards. When it comes to data visualization, the whole point is to make data presentable and easy on the eyes. This is where Whatagraph truly excels. Users simply can’t get over how nice the reports are to look at–they seem more like infographics than dashboards!
"Having used Data Studio, Supermetrics, Powerpoint, countless excel sheets and custom reports with the Facebook Marketing API over the last number of years, I have to say Whatagraph has been by far the shortest learning curve. We created our first live report in less than 10 minutes, and were able to share it with the client via a URL that allows them to select their prefered date range and check in on performance at any time throughout the month. Less time building reports, less time communicating by email, a win for all."
Amy CoyleHEAD OF CUSTOMER SUCCESS AT OPTILY 

What we love:
- Standout visuals
- Seamless integration with the major data sources
- Automated report delivery
- Pre-made templates
- Simple drag-and-drop interface
- Easy collaboration
- Amazing customer service
- They’re still in the early stages, so they really take feedback to heart and make improvements to their software
What could be better:
- Price is a bit steep–on par with Tableau (starting at $279/month for 5 users)
- Currently no Zapier integration
- Data sources are limited
- Backend UI is a bit cumbersome for customized reports
3. Google Data Studio
Sure, we’ve all worked with Google Analytics, but seeing as we have, we’re also familiar with its limitations. Data Studio is Google’s advanced option and a more reliable tool for marketers to pull reports and generate visuals. Data Studio is more of a bare-bones visualization and reporting tool. If you’re only dealing with a couple of main data sources and don’t need constant real-time updates across tons of ad platforms, CRM software, and sales data, then this could be a good fit for you. It’s free after all!
“There is an abundance of data sources for every marketer to leverage but the biggest challenge is managing them all. Tools such as Data Studio have simplified the process for data use. I can connect data sources within a couple of clicks, build a personalised dashboard within 2-3 minutes using pre-defined templates, and start using data to support every decision without the burden of ‘number crunching.’”
Kevin StaggMarketing & Customer Director 
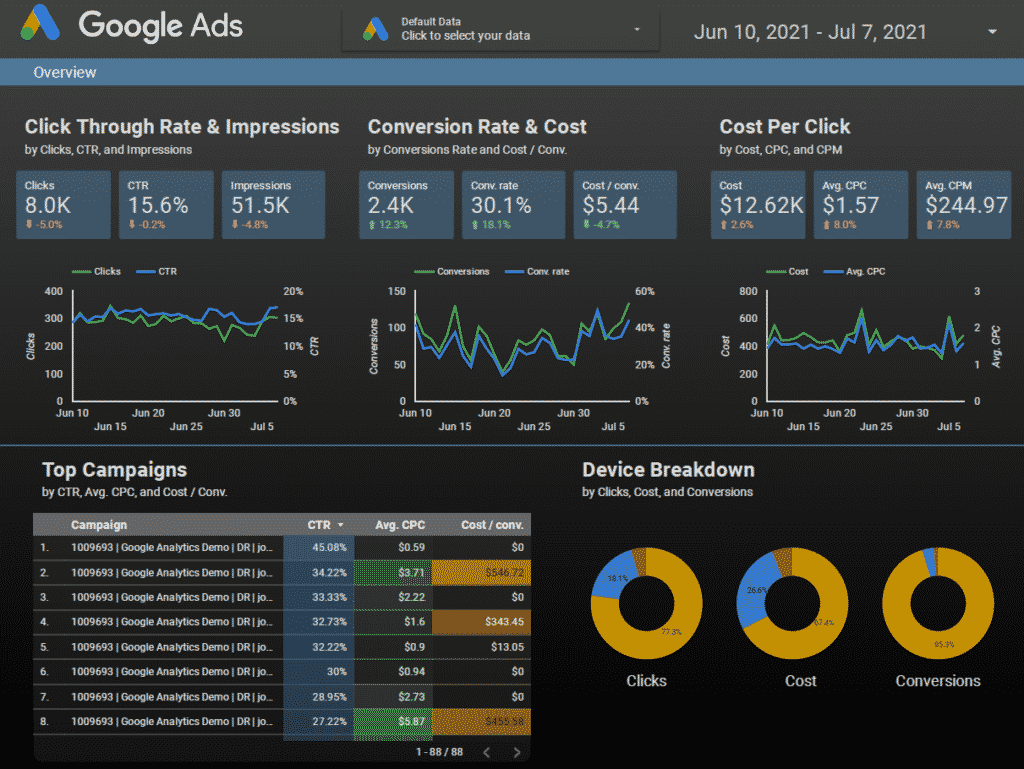
Source: Data Studio
What we love:
- It’s free
- You really can’t beat completely free, especially if you’re strapped for marketing budget already
- Drag-and-drop dashboard creation
- Instant syncing with other Google products
- Tons of widget options for hyper-personalization of dashboards
- Made-for-you dashboard templates and tutorials
What could be better:
- There’s no automated report building
- If you make a change to the root file, you need to manually refresh the whole thing
- No Facebook data reporting
- Blending data is a bit cumbersome
- Only 4 sources can be blended at a time and each additional one makes everything a lot slower
- Branding capabilities could be a bit more robust for the visualization tool